


Copper Price Hits New Highs in 2026
Copper Price Hits New Highs in 2026 – What’s Driving the Rally?
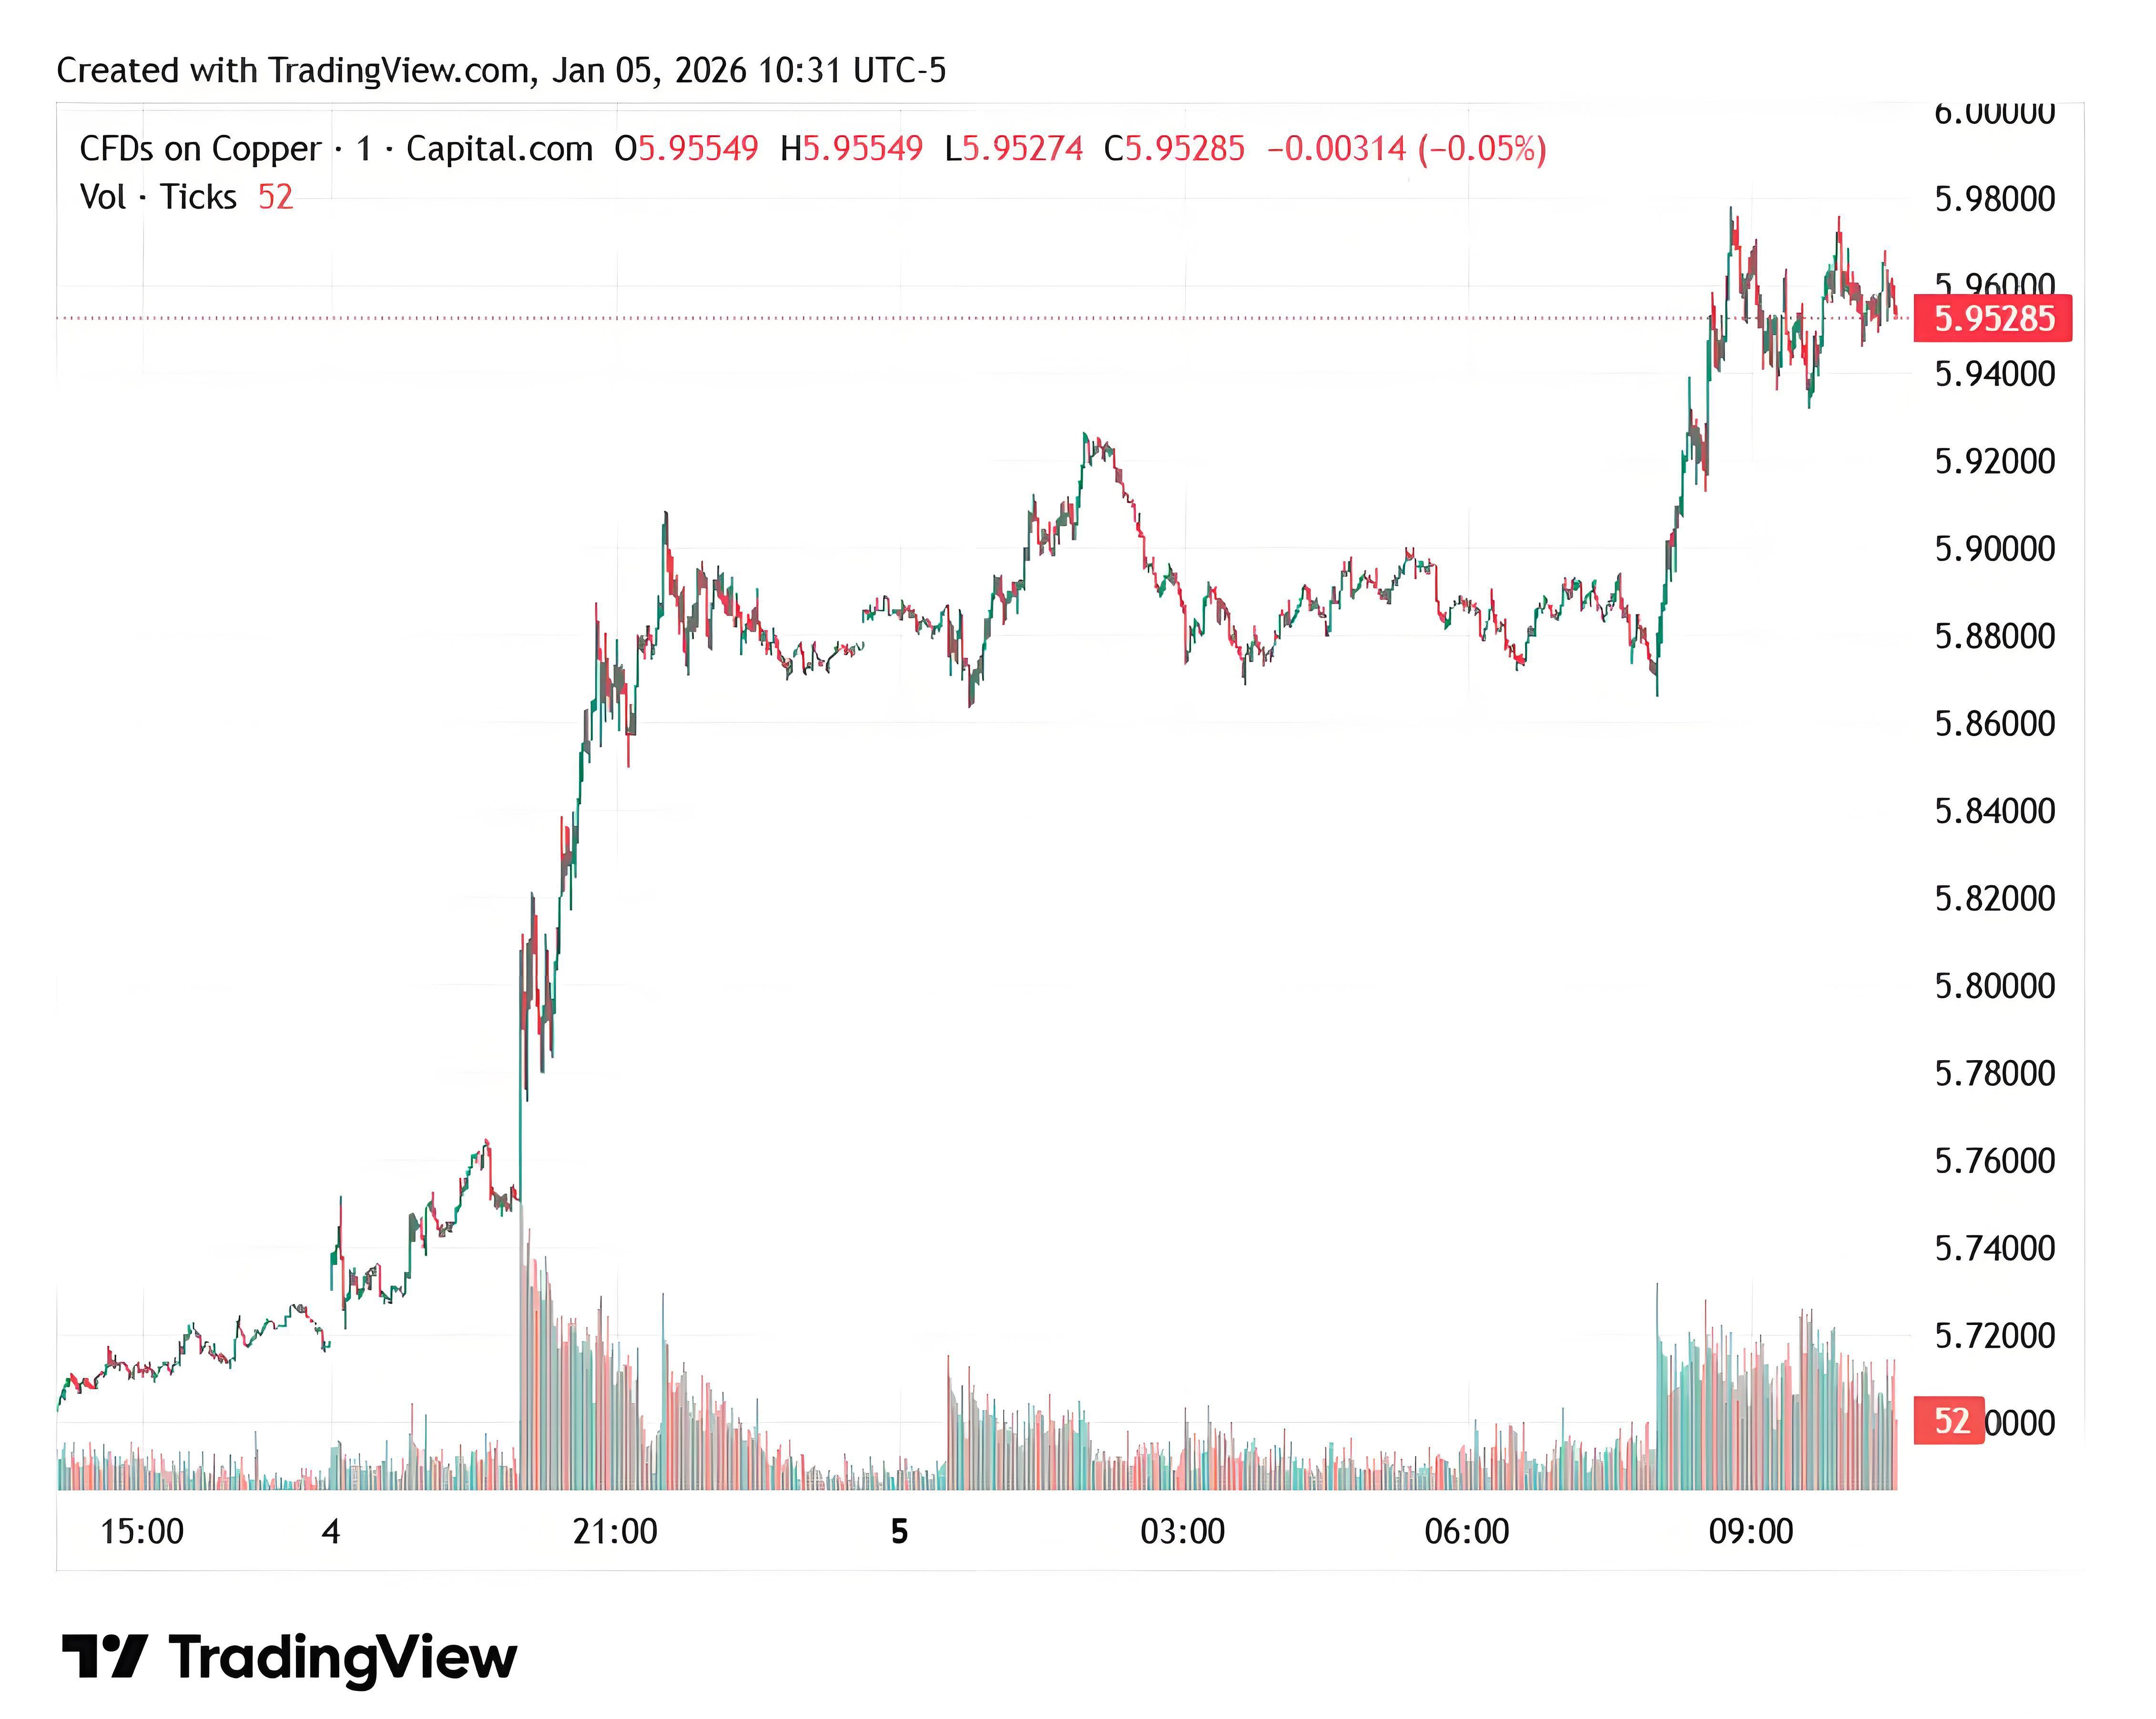
At the start of 2026, copper prices have once again broken historical records. What’s behind this surge?
On January 5, LME copper prices touched $13,000 per ton for the first time, briefly approaching $13,020 intraday. This breakthrough follows an impressive year: in 2025, copper gained over 43%, marking its strongest annual performance since 2009.
Among the six major industrial metals traded on the LME, copper was the top performer in 2025 — and this was no coincidence.
1. A Historical Perspective from the Charts
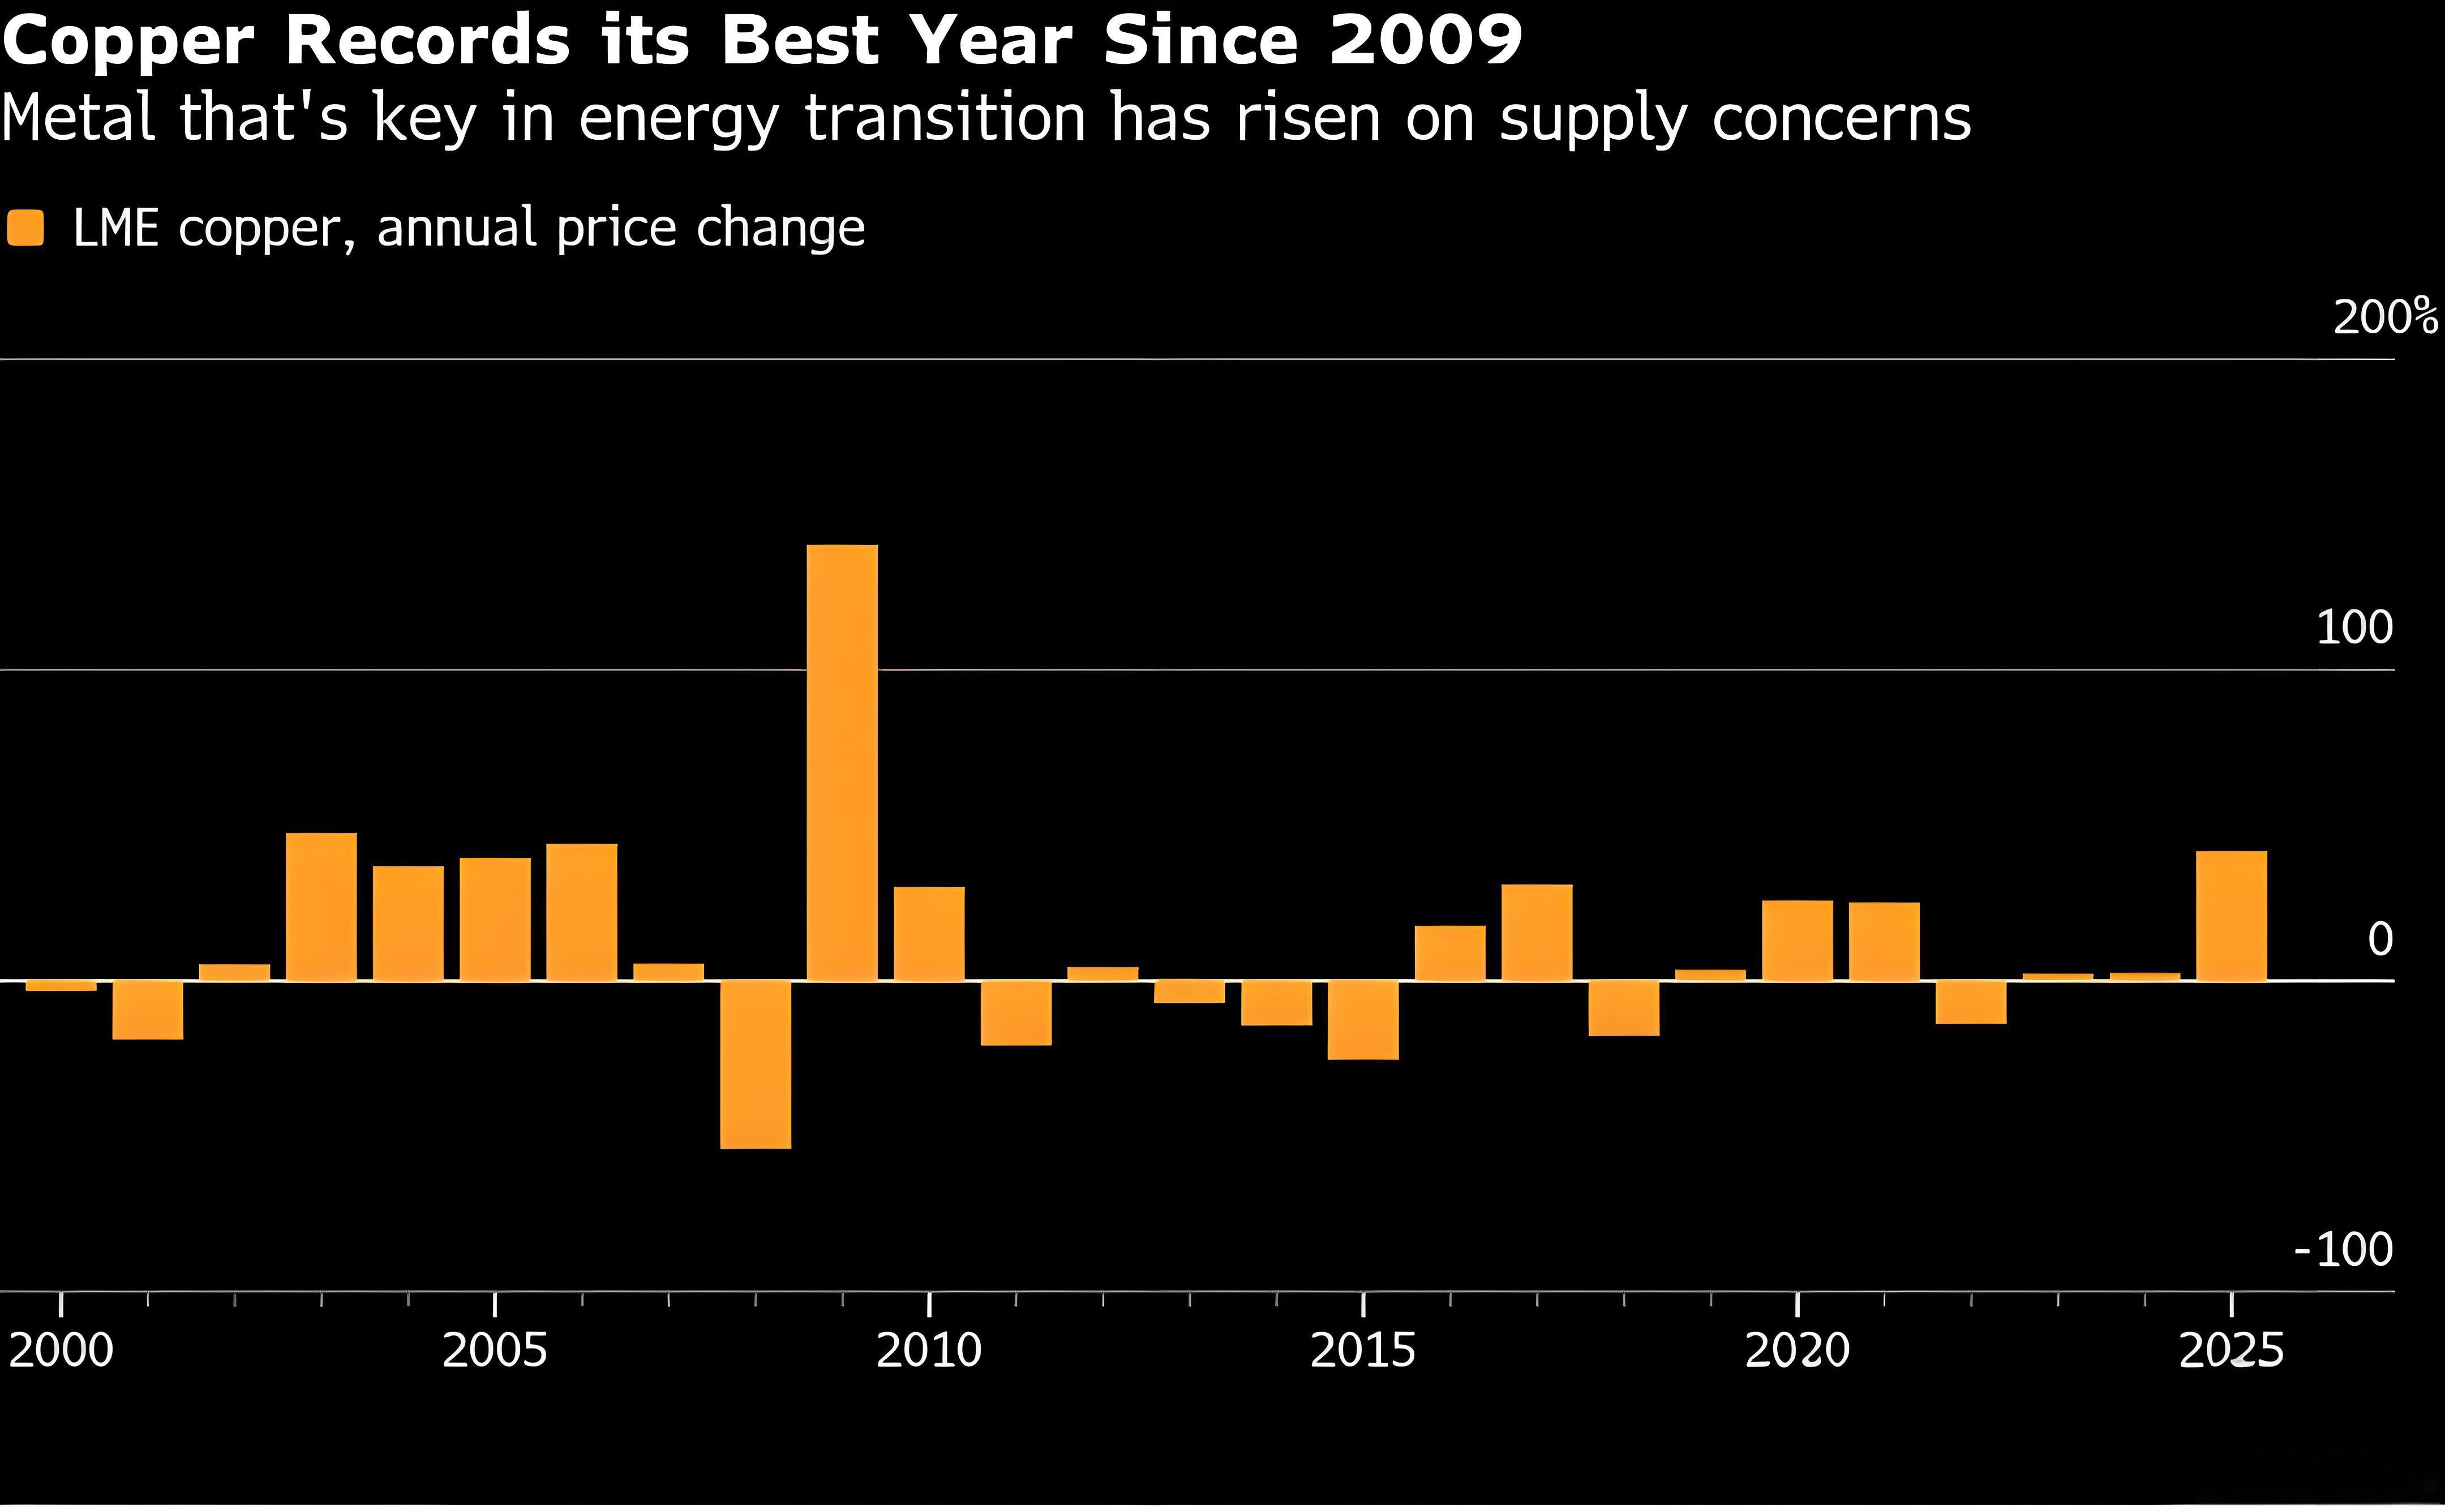
2025 was a breakout year not seen in over a decade. Looking at annual copper price changes on the LME:
· 2009: a post-financial crisis rebound (+100%+)
· The following decade saw cyclical swings, but nothing comparable
· 2025: gains of around 42%–43%
The difference?
· 2009 was a crisis recovery.
· 2025’s rally happened under normal economic conditions.
This suggests copper is being repriced.
---
2. Persistent Supply-Side “Bleeding”
In 2025, multiple key copper mines faced significant output disruptions, including:
· Grasberg in Indonesia
· Kamoa-Kakula in the DRC
Tensions have continued into 2026. Recent strikes at Chile’s Mantoverde copper mine have reignited market concerns.
Al Munro, Senior Base Metals Strategist at Marex, noted: “This is a spec-driven rally. The market still sees upside, especially in Q1 2026, with many waiting for a pullback now forced to enter.”
ING’s view is even clearer: “Years of underinvestment + ongoing mine disruptions leave the market with almost no buffer.”
3. What’s Amplifying the Move: “Tariffs + Stockpile Mismatch”
Recent expectations that the U.S. may reimpose copper tariffs have redirected global copper flows. The result?
· Traders accelerating shipments to the U.S.
· Rising U.S. inventories
· Tighter physical supply elsewhere
UBS highlights a key imbalance:
· The U.S. holds about 50% of global copper stocks
· But accounts for less than 10% of global demand
👉 Stockpiles are concentrated where they aren’t being consumed.
👉 The rest of the world is effectively left short of copper.
---
4. The Physical Market Is Already Telling the Story
A key signal from the LME right now:
· Persistent backwardation in the cash-to-3-month spread
This usually happens for one reason: genuine near-term tightness.
From mine disruptions and tariff distortions to structural inventory imbalances, this copper rally isn’t just sentiment-driven. It reflects:
· The culmination of long-term supply underinvestment
· Policy-driven market distortions
· Money following the narrative
$13,000/ton looks more like a milestone than the final chapter.
Remarks: This analysis is by Yuner, Canada
-

The Rainy Season is Coming – Is Your Drainage Pump Ready?
– Is Your Drainage Pump Ready?
넶4 2026-05-27 -
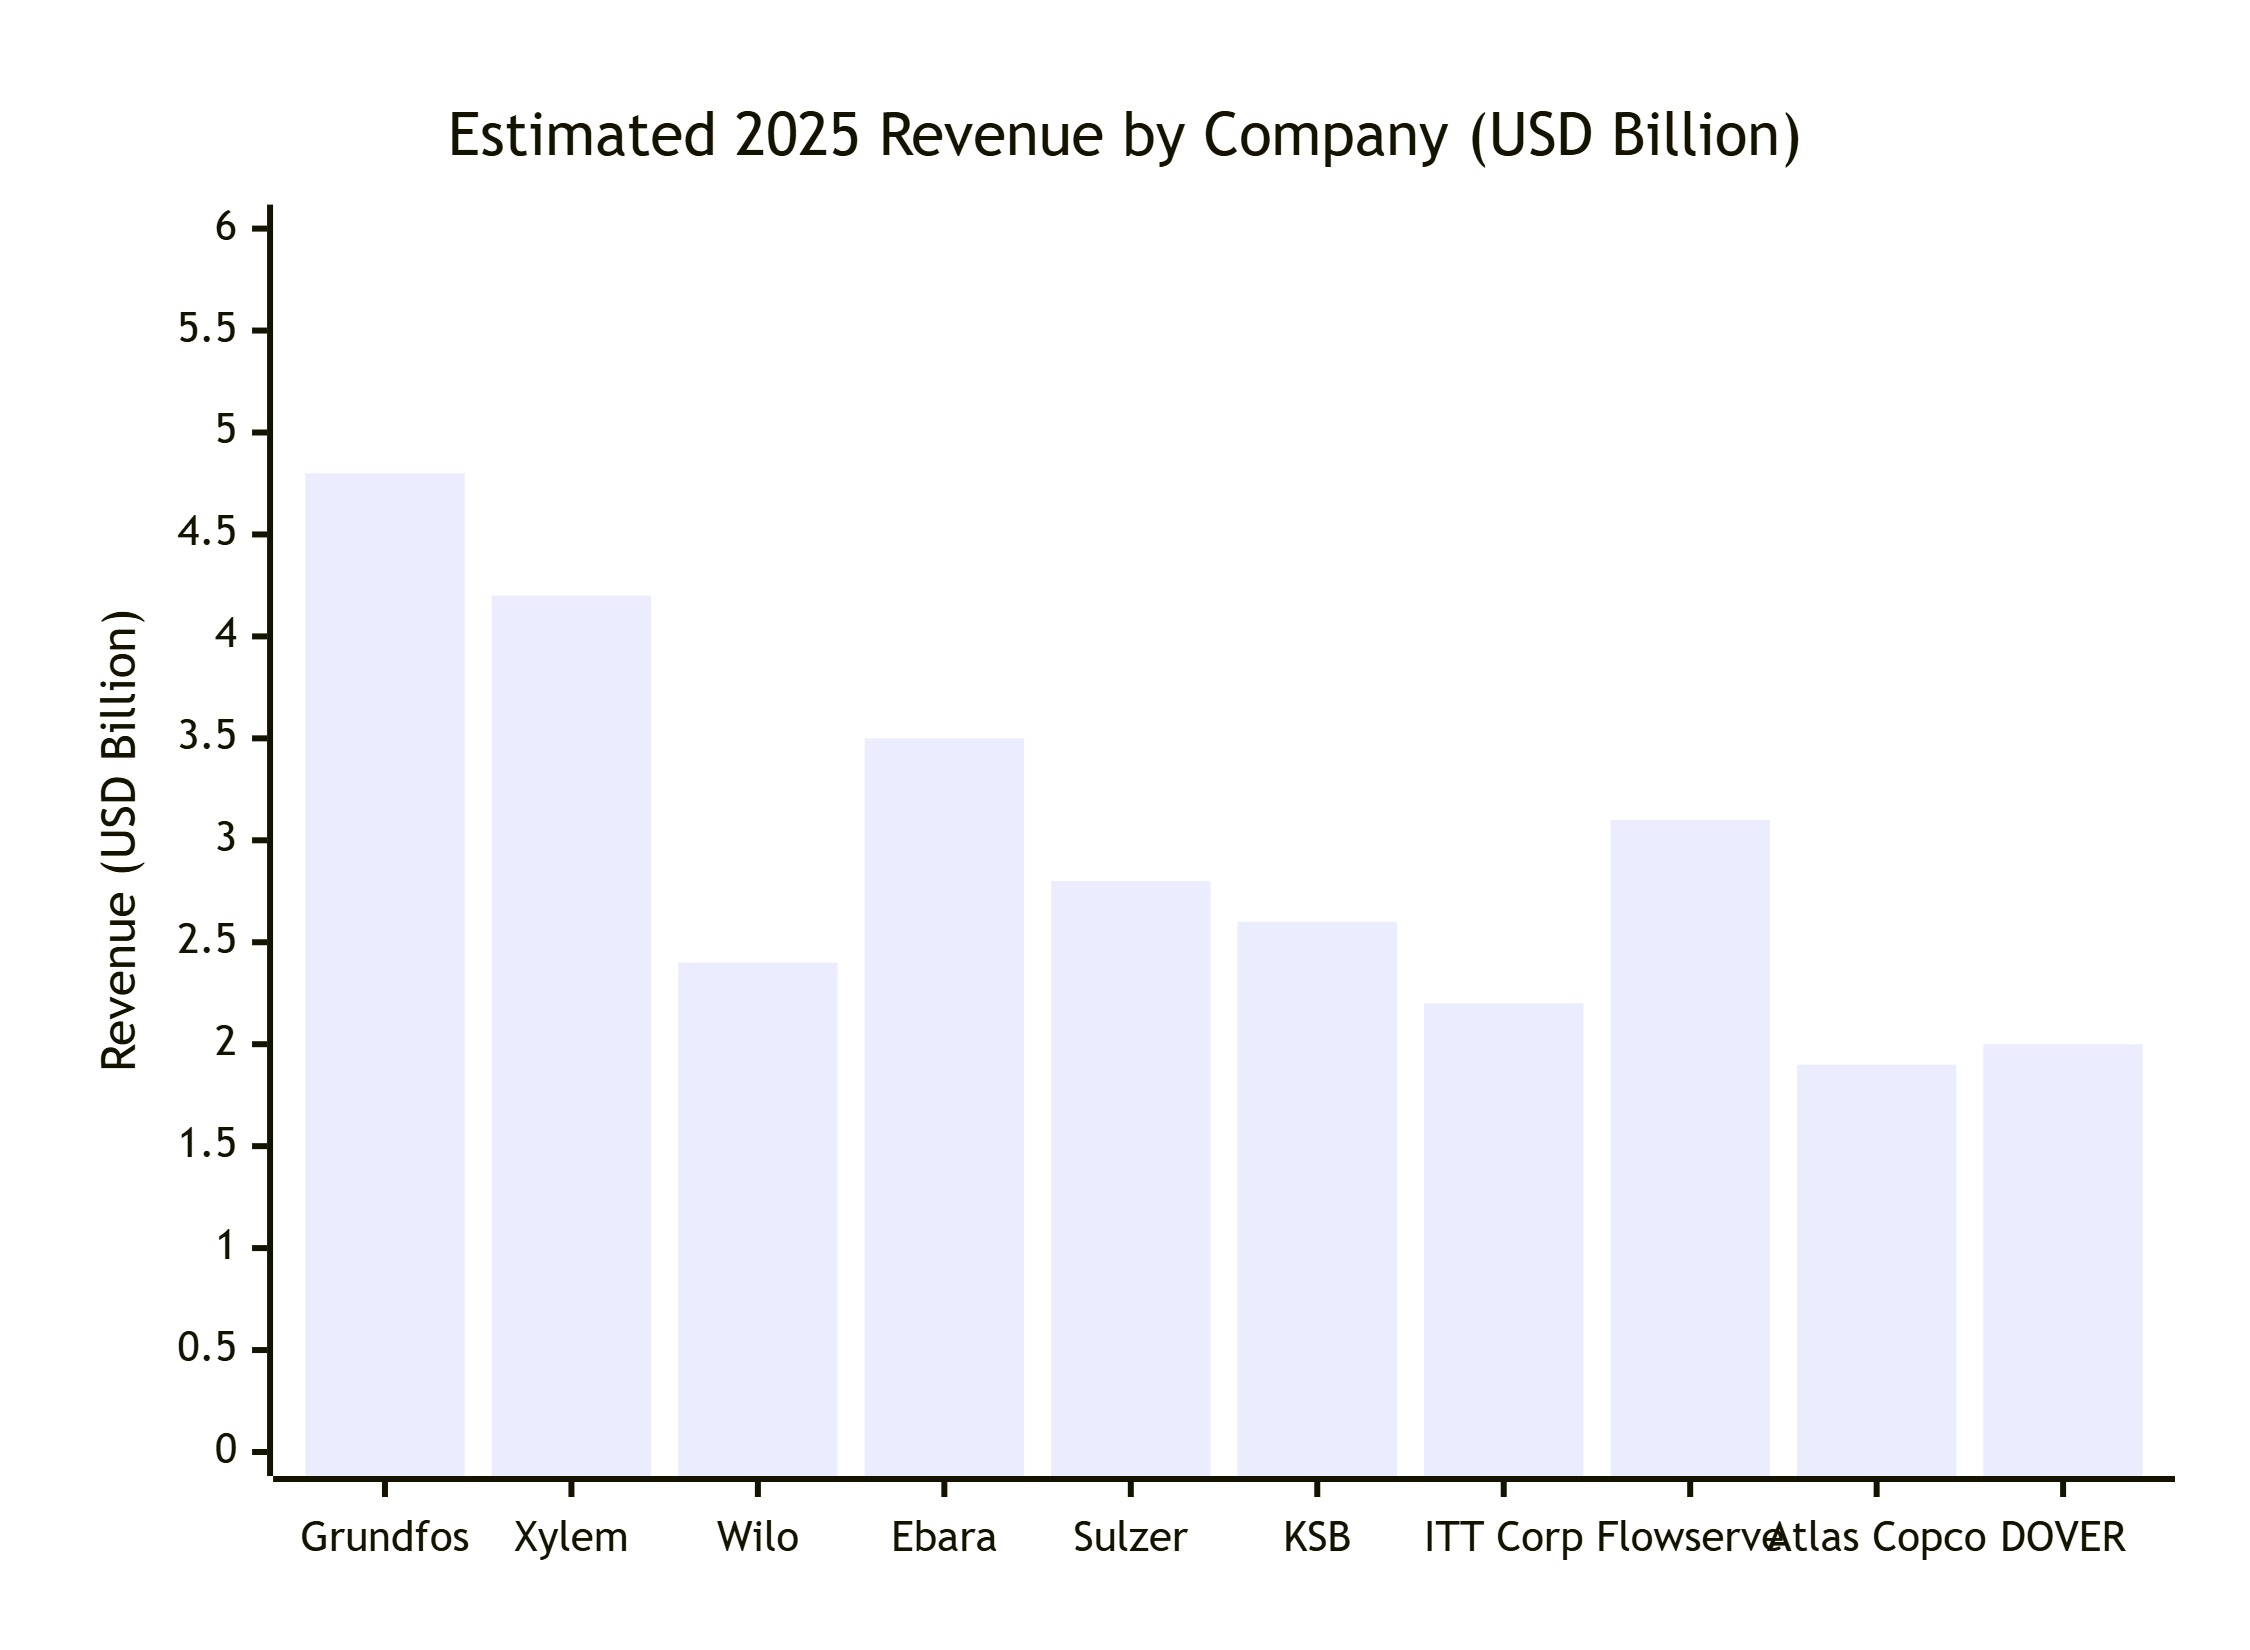
2025 Global Pump Industry Sales Ranking: Key Players & Market Trends
Key Players & Market Trends
넶11 2026-05-12 -

Celebrating Labour Day: The Fluid That Moves the World
The Fluid That Moves the World
넶18 2026-04-30 -
New Opportunities for the Pump Industry in the AI Era
The Liquid Cooling Pump & Valve Market Takes Off
넶22 2026-04-24


